#Background: The Altman Z Score is
#Questions: How does the Altman Z-Score work?
How much should we remove from the dataset?
Why are these values so skewed?
How do we differentiate between values that are skewed+important vs those that just create noise?
#Exploration:
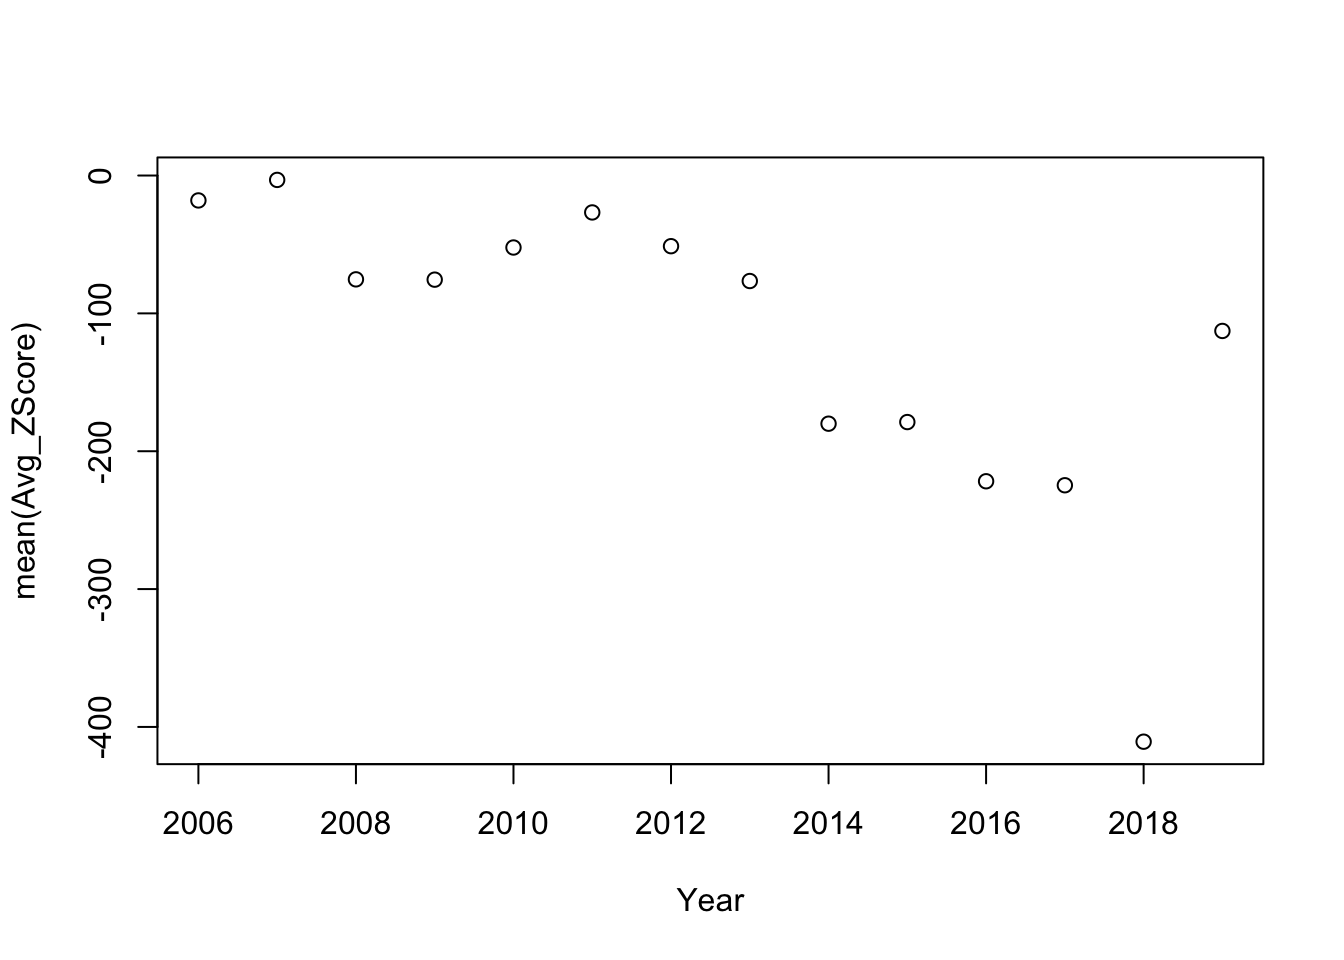
We can see that the data is skewed heavily towards the negative so removing this data is necessary to effecitvely see how the z-score is changing.
library(readxl)
library(ggplot2)
library(dplyr)
##
## Attaching package: 'dplyr'
## The following objects are masked from 'package:stats':
##
##     filter, lag
## The following objects are masked from 'package:base':
##
##     intersect, setdiff, setequal, union
ZScoreYearsSummaryV3 <- read_excel("~/Downloads/ZScoreYearsSummaryV3.xlsx")
plotthis <- ZScoreYearsSummaryV3 %>%
  mutate(Year = substr(ZScoreYearsSummaryV3$DATADATE,1,4)) %>%
  group_by(Year) %>%
  summarise(mean(Avg_ZScore))

plot(plotthis)
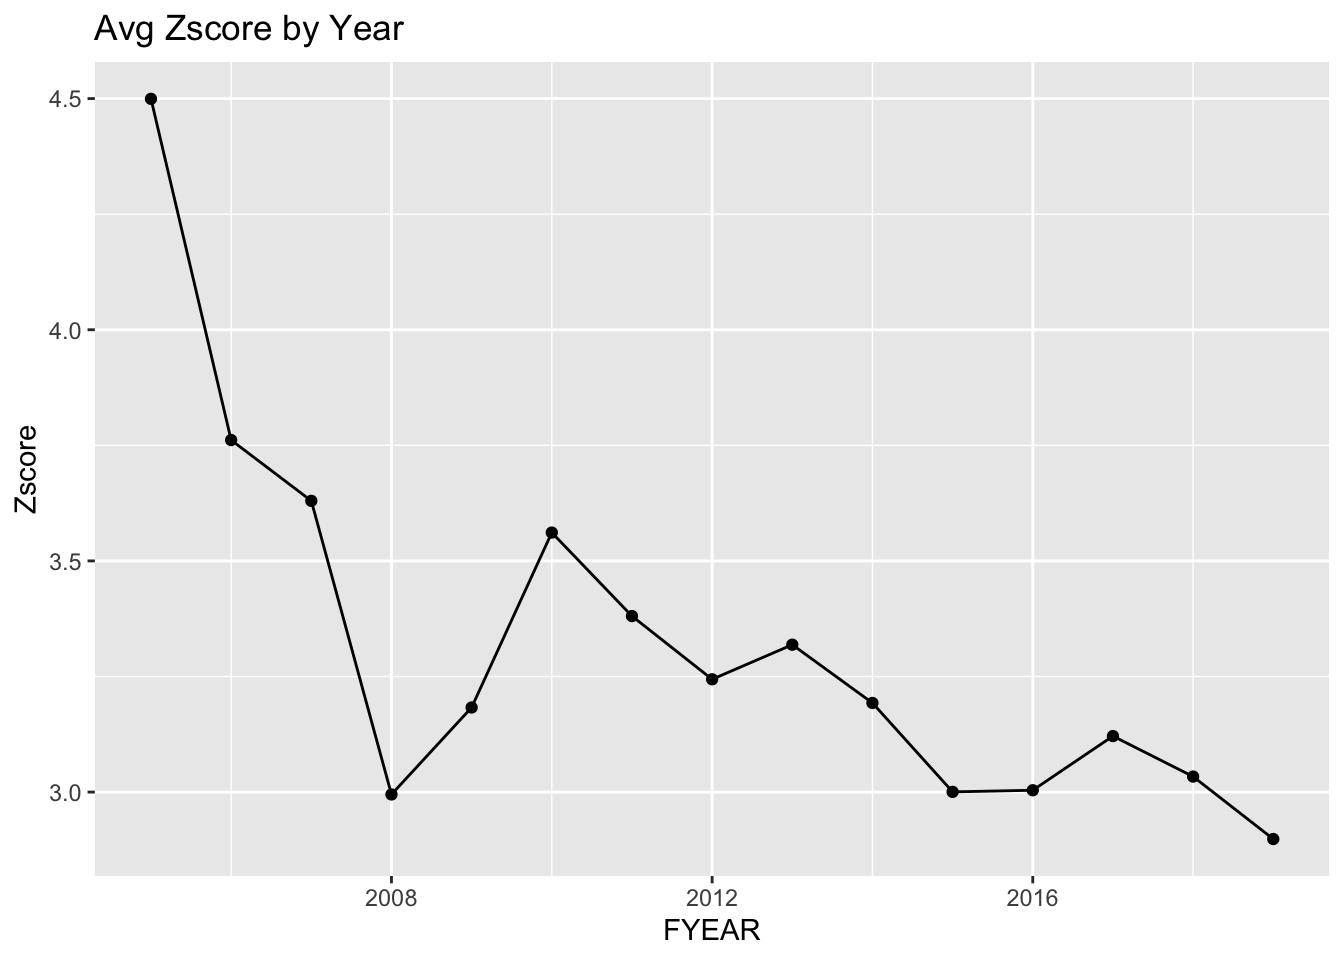
Once removing this information we find the following changes:
library(readxl)
library(ggplot2)
library(dplyr)
library(haven)
q188f447abac283de <- read_sas("~/Downloads/q188f447abac283de.sas7bdat",
    NULL)

A = 1.2*(q188f447abac283de$WCAP/q188f447abac283de$AT)
B = 1.4*(q188f447abac283de$RE/q188f447abac283de$AT)
C = 3.3*(q188f447abac283de$EBIT/q188f447abac283de$LT)
D = 0.6*(q188f447abac283de$MKVALT/q188f447abac283de$LT)
E = 1.0*(q188f447abac283de$SALE/q188f447abac283de$AT)

DataZscore <- q188f447abac283de %>%
  mutate(Zscore = A+B+C+D+E) %>%
  filter(Zscore != 'NA', Zscore > -2.199, Zscore < 13)

ZscoreGroupedbyFY <- DataZscore %>%
  group_by(FYEAR) %>%
  summarise(Zscore=mean(Zscore))

ggplot(ZscoreGroupedbyFY, aes(x = FYEAR, y = Zscore))+
  geom_line()+
  geom_point()+
  ggtitle('Avg Zscore by Year')
This graph represents the few intuitions that we may have had about Z-scores in the market during this period: 1) The average Z-score should be positive because we expect the average company to not be in financial distress 2) The Z-score should have been skewing downwards during the recession
The thing that interests me about this graph is the continual decline since 2010. Why is this happening? Are more companies in financial distress?